Planetspotting
#python #numpy #pandas #matplotlib #indesign
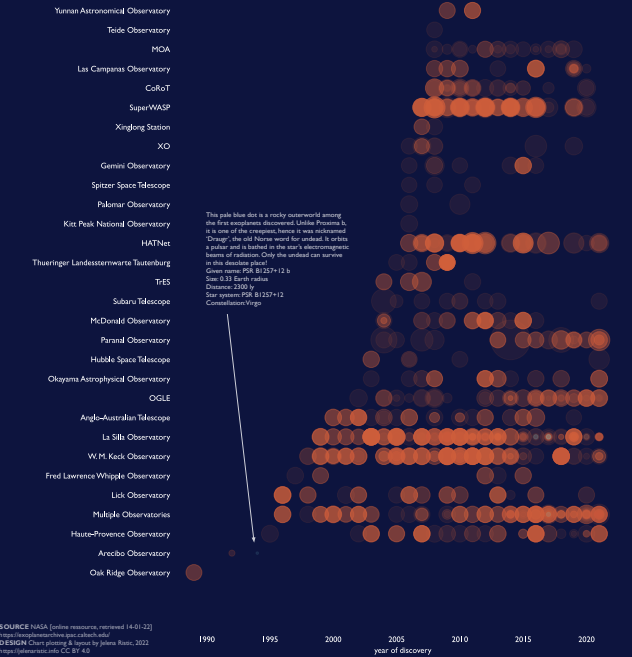
Since the first exoplanet was discovered in the late 1980s, more
and more eyes have looked up and further, screening remote
stellar systems for hidden planets, some of which may be just
like ours. This bubble chart represents the 4905 exoplanets
discovered to date, based on data provided by NASA. The
facilities and the year of discovery provide its main structure.
The red colour indicates planets that are larger than Earth. The
blue colour represents exoplanets with a radius up to 1.1 times
that of Earth. The size of a dot is in proportion to the planet’s
size. The larger the dot, the larger the planet. The transparency
is based on the number of stars in the exoplanet’s home system.
The fainter the dot, the fewer the stars in the system. As the
data is limited to the year of discovery, overlapping is inevitable.
Data source: NASA [online ressource, retrieved 14-01-22]
https://exoplanetarchive.ipac.caltech.edu
You can download the infographics in pdf here.