Biomass treemap
#python #pandas #plotly #matplotlib #squarify #indesign
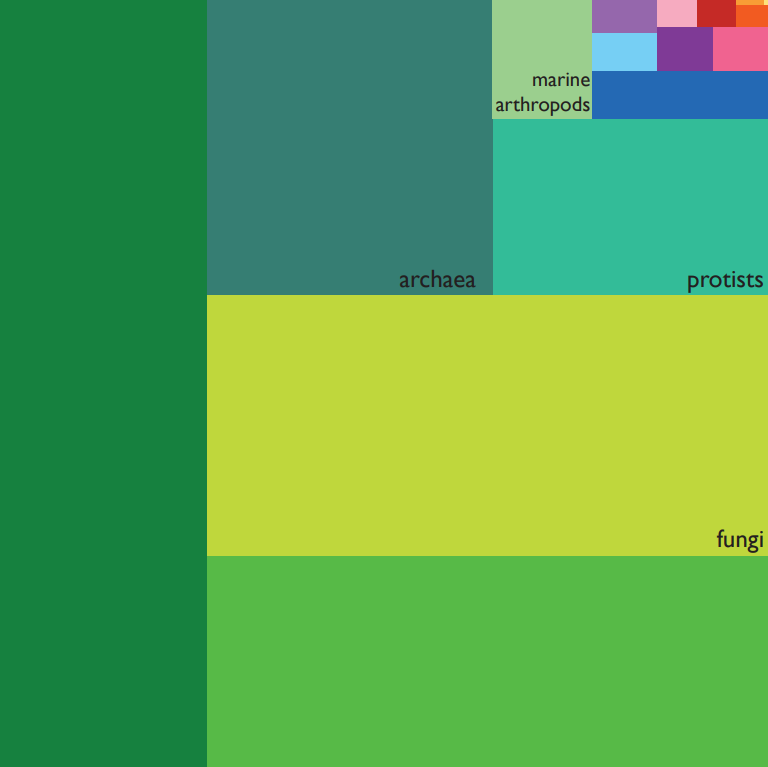
This treemap chart displays the total biomass, i.e. the mass in tonnes Carbon (t C) of all living beings on Earth proportionally,
from the biggest group to the smallest. The main chart shows all the groups and the insert chart zooms into the crowded
top right corner of the main chart to give a clearer view. Wild birds and mammals total the lowest biomass (4 million t C),
whereas domesticated animals reared for food (livestock, 100 million t C) surpass humans (60 million t C). With their total
mass of 450 billion t C, plants rule the world. All creatures together amount to 545.8 gigatonnes of carbon (Gt C).
Data source: Y Bar-On, Y. M., Phillips, R., & Milo, R. (2018). The biomass distribution on Earth. Proceedings of the National Academy of Sciences, 201711842. [Online ressource]
http://www.pnas.org/content/115/25/6506
You can download the infographics in pdf here.